Become the Dashboard Master in your organization.
Take your dashboards to the next level, making them faster and more powerful with simple recorded macros.
No programming experience required!
 There are many ways to skin a cat, and many ways to make dashboards in Excel. The best way is always task-dependent, but a few recorded macros can replace hundreds of formulas, improve calculations and make your dashboard more reliable. You can go a long way with lookup formulas, but macros will open up a whole new world. And chances are, whatever your problem is you’ll find a macro online that solves it.
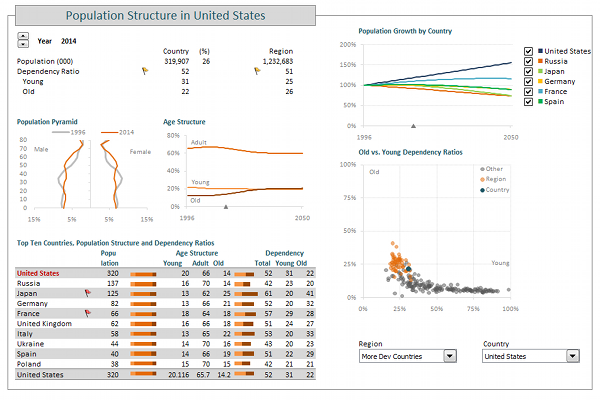
Create powerful dynamic dashboards that make your business data come to life and establishes you as the dashboard expert in your organization. With these tutorials you’ll see how to go from a blank page to a fully functional dashboard, step-by-step. This example dashboard uses many different techniques that you can use in your own projects.
How it works.
A 12-module course that shows you every single step I took to create the dashboard above. This dashboard contains:
- Forms that allow the users to interact with the data;
- How to connect your dashboard to an external data source;
- Dynamic charts that change when the data changes (based on user selections);
- Advanced Excel functions like OFFSET() and INDIRECT() ;
- Advanced pivot tables;
- Recorded macros;
- More than two hours of video;
- The Excel dashboard itself;
- The external data source.
Now, while you learn how to make Excel charts like a pro, you can apply these best practices to your dashboards. Get access to two dashboard tutorials, more than three hours of step-by-step videos that will help you unleash your creativity and create great dashboards using Excel. And you also get access a growing number of bonus files that you can explore and use to improve your Excel skills.
(Two dashboard courses only $97.00. 24-month access to the tutorials, 30-day, no questions asked, full money-back guarantee. Pay securely with your Paypal account. You’ll get a message from Amazon with a link to your gift a few hours after your purchase.)
The Demographic Dashboard VBA Tutorial
Each of the images below links to the page modules. If you need to login first, use the form in the page footer.
To tell you the truth, I don’t like the word “lie”: it feels obvious and unsophisticated. I prefer something like “reframing truth”, “alternative facts” or an English word I recently…
I’m still in shock. Such a stupid Excel mistake. I should know better, but it was Monday, so… Let me tell you about it. It’s as mistake as old as…
A single horizon chart is easy to make in Excel using overlapping columns or areas (the trick is to structure the data the right way). But the horizon chart is…
I need to learn PowerBI, as soon as possible (per client request). So, I spent much of last week using it. I wrote about the depressing experience on Twitter. I…
When I saw Paris for the first time I was like, meh. Not Paris’ fault. This was the second leg of a trip that started in Prague, and I was…
How do Excel and Tableau compare when actually making a chart? I couldn’t find such post, so I wrote one. I’ll create a simple chart, a population pyramid, and comment…
After creating wordless instructions for making charts in Excel, here is the Tableau version. This post discusses similarities and differences between both tools. Check out the e-books at the bottom!…
An ebook that uses visual instructions to show how to make charts in Excel. Non-English speakers should be able to follow these instructions.
It began with a tweet: Data tweeps: Help! I need to become a competent data viz thinker, well, immediately. Are there “must-read” sources that y’all can suggest? — Lindsey Leininger…
This post summarizes a few key points in my NTTS2017 effective data visualization for statistical offices