Time Magazine published a very boring combo dual-axes chart with a broken scale. Most of the time these charts beg for a connected scatterplot, so I made the one above. The original chart was something like this: 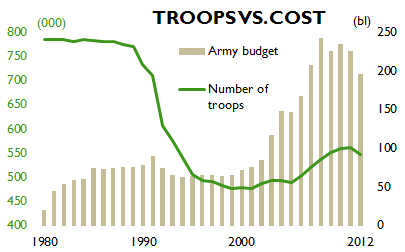 I’m sorry, Time mag, but my chart tells hands down a much more interesting story. [fusion_builder_container hundred_percent=”yes” overflow=”visible”][fusion_builder_row][fusion_builder_column type=”1_1″ background_position=”left top” background_color=”” border_size=”” border_color=”” border_style=”solid” spacing=”yes” background_image=”” background_repeat=”no-repeat” padding=”” margin_top=”0px” margin_bottom=”0px” class=”” id=”” animation_type=”” animation_speed=”0.3″ animation_direction=”left” hide_on_mobile=”no” center_content=”no” min_height=”none”][UPDATE] Made a new, annotated version.[/fusion_builder_column][/fusion_builder_row][/fusion_builder_container]
10 thoughts on “Chart redraw: Troops Vs. Cost (Time Magazine)”
Comments are closed.
I have to admit, I find the dual axes version easier to read. It takes more thought to work out what the story is in the scatterplot, at least for me.
Nice work! I don’t like dual-axes charts either. Also, the original has a bar graph with no zero. When one judges length a zero baseline is needed.
the budget adjusted for inflation?
Thanks Naomi. I think dual-axes charts are even more misleading, deceptive and dangerous than a simple bar chart with no zero.
Serg: I’d like to know that too. There is no note/reference in the original chart and I had no time to read the full article to check.
It’s an interesting way but I’m with Tom, it takes more time to understand what’s going on in the scatterplot version. In fact you were forced to repeat two small time series to show budget and troops evolution.
What about using a common starting point? Take a look to that approach:
https://dl.dropboxusercontent.com/u/936398/troopsvscost.png
Álvaro: I wasn’t “forced” to use the time series. I wanted to add a chart to show variation for each series. They were added not because people can’t understand the main chart but because they add detail to the analysis. To help reading it I added arrows that explain what each turn means.
The purpose of this chart is to show variation of one series against the other. You can’t do that with a dual-axes charts, no matter what you do.
Your example and the original chart can’t show all the twists and turns in the data, mainly the changes every 10 years.
Now it takes more time to understand the scatter plot, but that’s just because you have read more of them. Just wait and you’ll see.
I agree the scatterplot it’s an interesting proposal. In fact NYTimes uses the same model quite often (http://www.nytimes.com/imagepages/2010/05/02/business/02metrics.html). Not so sure about people understanding it. It clearly depends which is your target audience. I suggest you to test it with all kind of people not just blog visitors.
I miss some context on both graphics. Why the cost went up. I feel the labels I added to my proposal do the trick.
No matter the choice of graph, the implicit message in presenting this data is that there is something to be gleaned from looking at the correlation (or lack thereof) between these two variables. Your redesign makes it very clear that headcount and budget can vary widely independently of each other, perhaps more than one might expect.
I wonder whether two parallel time series–number of troops and budget in dollars/troop–might support the same conclusions while making it easier for the viewer to overlay his or her knowledge of recent administrations (figuring out which party to blame seems to be the implied next step in any governmental spending graph).
I’m afraid I have to disagree with you. I much prefer the dual-axis. Especially when presenting this kind of data to the uneducated, the dual-axis wins every time.