Microsoft is apparently waking up and getting a bit more serious regarding visualization in Excel. Excel 2016 gets a few more chart types but, except for treemaps, nothing really new. We could make them with a little of work, but it’s nice to have them ready to use.
Here are the new chart types in Excel 2016:
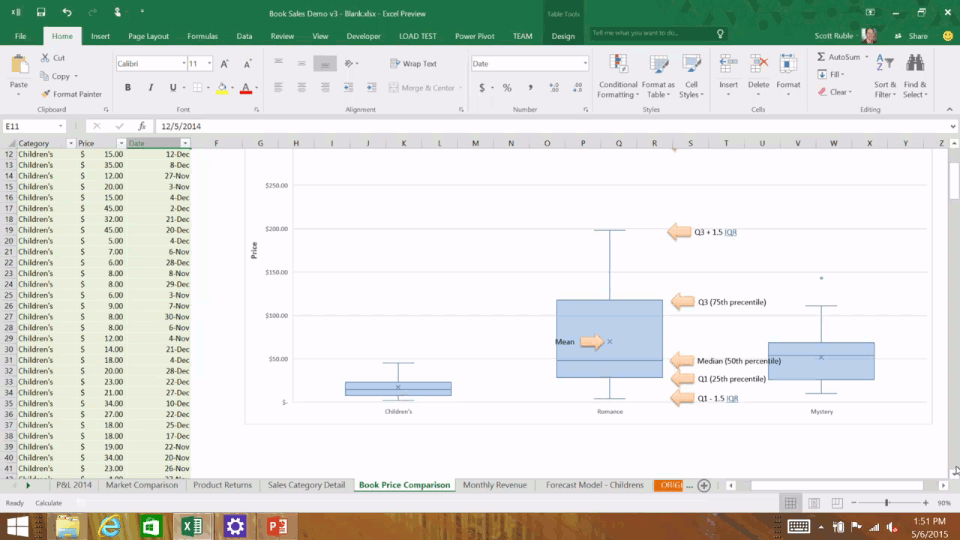
Boxplots (box-and-wiskers)
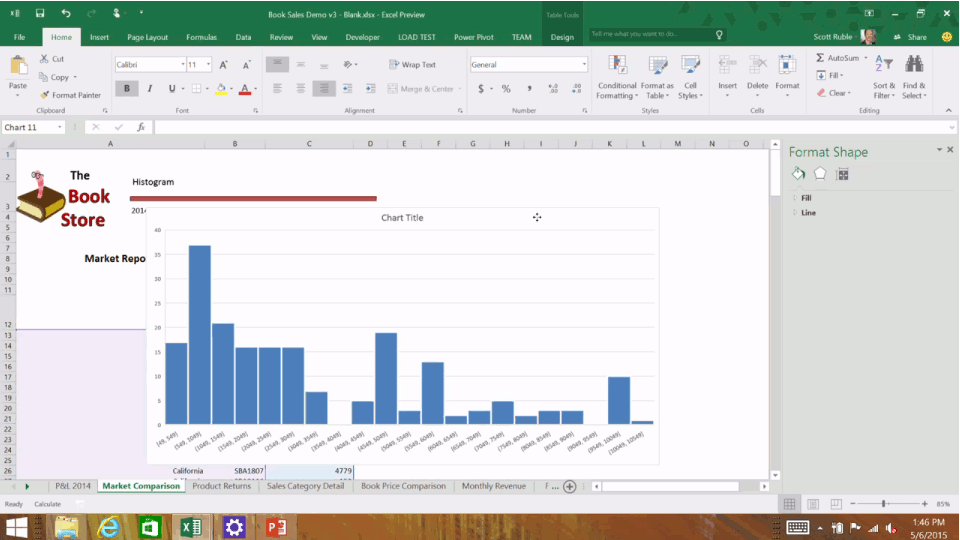
Histogram
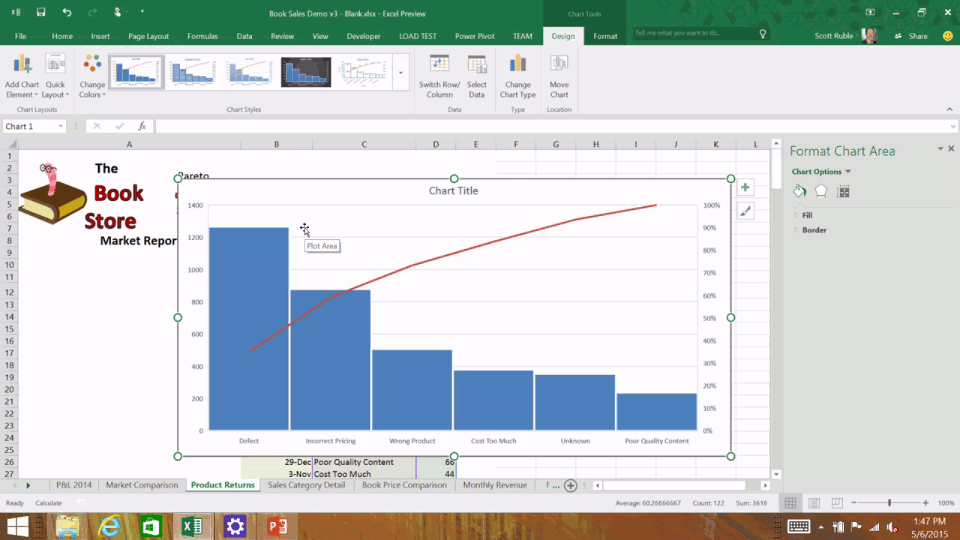
Pareto
Sunburst (I prefer to call them multi-level pies)

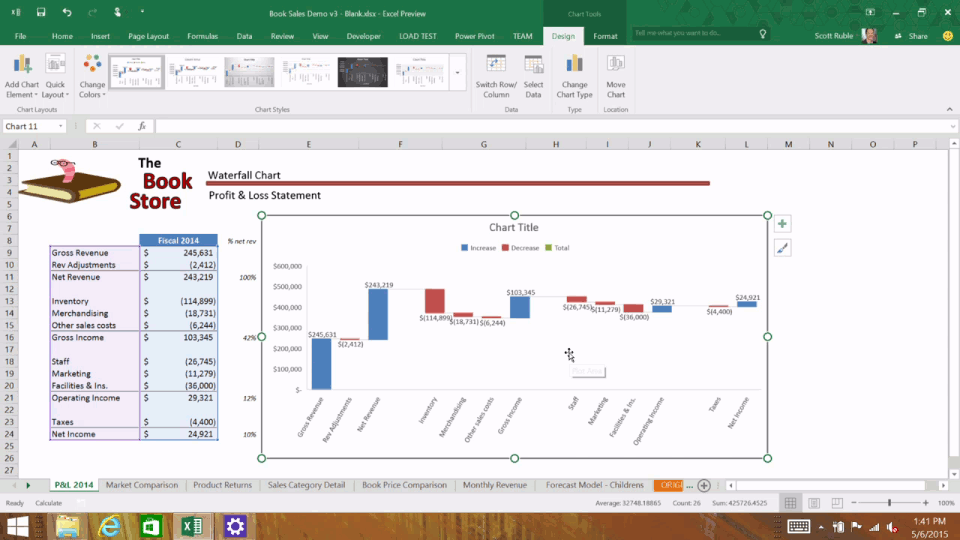
Waterfall
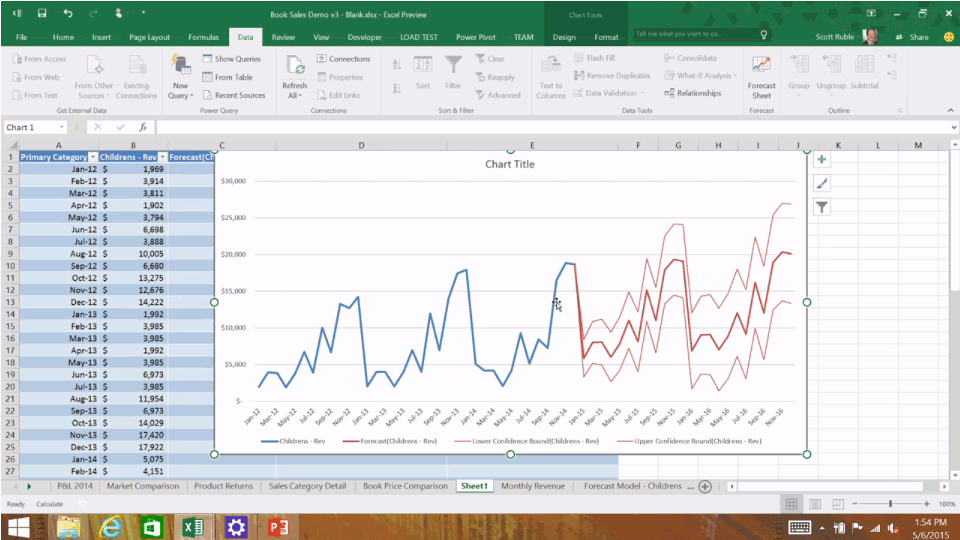
Forecasts
So, what’s the missing elephant? For me, the elephant is the ability to turn every single chart into small multiples. I would trade all those charts above for that functionality, any day.
What’s your missing elephant?
These images come from a presentation by Scott Ruble you can watch below: